2019-04-05

How to handle unicode chars in Hadoop FS names on Ubuntu


Once i've caught myself staring on the weird unicode characters in names of files and folders within my hdfs directory browser on web. I haven't even seen such chars before, like this: ζ, ₫, etc. Of course, I wasn't successful in their deletion via Ubuntu shell because they are not ASCII.

But Hadoop wildcards allowed me to do so.

It was a luck these chars were only at the beginning of the names, so, this might comes in handy for such occasions. Simply run the following shell command under hdfs user to get all names which don't start from a regular ASCII chars

$ hadoop fs -ls /{whatsoever_folder_name}/'[^a-z_0-9]*'

2016-12-08

Outliers detection - Part 1

Sometimes, we need to work with data which is seems to be correct but in fact is not.
It often happens especially with telemetry data, collected by different sensors, like humidity or temperature. Something might go wrong. 

Lets consider such situation. For example we have some temperature observations in the room during a winter.
import numpy as np
data = [24, 24, 24, 22, 16, 26, 15, 24, 16, 26, 18, 
        20, 16, 50, 23, 22, 25, 42, 18, 19, 17, 21, 
        26, 19, 16, 20, 17, 23, 22]
print("Array len; %d, mean: %0.3f, median: %0.3f, std: %0.3f" \
       % (len(data), np.mean(data), np.median(data), np.std(data)))

# this will be an output:
# >>> Array len; 29, mean: 22.448, median: 22.000, std: 7.323
Well, nothing strange so far, ain't it?. Sure, we might spot abnormal values just looking on the list. but what if we have a list with thousands of elements?
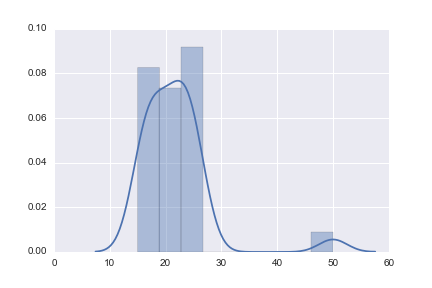
There is an easy way to spot it on the graph:
import seaborn as sns
import matplotlib.pyplot as plt
sns.distplot(data)
plt.show()
This code with plot you this graph, where you can easily find an abnormal observation.

If you dont have a seaborn or don't want to deal with it, you can just try to use standard hist method from matplotlib:
import matplotlib.pyplot as plt
plt.hist(data)
plt.show()
It will plot you this (yes, it's less fancy, but still a quick and essential python tool):

Te be certainly sure we could try to look on measures of central tendency. Just sort your data and try to look at mean, median and standatd deviation throwing out some max elements:
data = sorted(data)
print("Whole data - mean: %0.3f, median: %0.3f, std: %0.3f" \
       % (np.mean(data), np.median(data), np.std(data)))
for i in range(1, 3):
    data_slice = data[:-i]
    print("Without %d max elem - mean: %0.3f, median: %0.3f, std: %0.3f" \
           % (i, np.mean(data_slice), np.median(data_slice), np.std(data_slice)))
And here you can spot a significant change in standard deviation without a single element:
Whole data - mean: 21.750, median: 21.500, std: 6.434
Without 1 elem - mean: 20.704, median: 21.000, std: 3.505
Without 2 elem - mean: 20.500, median: 20.500, std: 3.411
Literally it means that your data might  contain some outliers, because it is much more accurate and less spread even without a single element. But to be 100% sure we need to do more math. Which I'm going to reveal in the next part very soon.

Stay tuned and love your data.

2014-05-08

Find all words within quotation chars with Python

Today I've spent about an hour googling everywhere to find out how to get all words within quotes "" from the text.
And here is my result:

import re

def match_quotes(s):
    return re.findall(r"\"(.*?)\"", s)

if __name__ == "__main__":
    print match_quotes('Example of "quotation string" with several "quotes"')


Another one regex issue is to find a part of the string from the certain char till the end:

import re

def match_end_of_the_string(s, c):
    return re.findall(r"%s(.*?)$"%c, s)

if __name__ == "__main__":
    print match_end_of_the_string('Example of #commented string', "#")
Certainly, it's less obvious than split() approach. :)

2014-02-10

Python, matplotlib: plot the partially colored histogram

Last week was really useful from perspective of new experience. I've faced a problem of building the colored histograms on some data. For this I used an awesome library matplotlib. The plotting of histogram itself was quite easy, but the coloring of the separated bars on the histogram was really-really challenging. I've spent about 3 hours browsing an internet before figured out a solution. And now I'm about to share this knowledge.

Before start:
  • Download and install matplotlib following the instructions on the official web site
  • You might be asked to install some other libraries, like numpy or dateutil and so on. Don't hesitate to install them.

import matplotlib.pyplot as plt
import random
def buildHist(data):
    # define window size, output and axes
    fig, ax = plt.subplots(figsize=[8,6])
    # set plot title
    ax.set_title("Colored Histogram")
    # set x-axis name
    ax.set_xlabel("Random Number")
    # set y-axis name
    ax.set_ylabel("Number of Records")
    # create histogram within output
    N, bins, patches = ax.hist(data, bins=50, color="#777777")

    # Iterate through all histogram elements
    # each element in this interation is one patch on the histogram, where:
    # - bin_size - number of records in current bin
    # - bin - value of current bin (x-axis)
    # - patch - a rectangle, object of class matplotlib.patches.Patch
    # more details on patch properties: http://matplotlib.org/api/artist_api.html#matplotlib.patches.Patch
    for bin_size, bin, patch in zip(N, bins, patches):
        if bin_size == max(N):
            patch.set_facecolor("#FF0000")
            patch.set_label("max")
        elif bin_size == min(N):
            patch.set_facecolor("#00FF00")
            patch.set_label("min")
    # add legend to a plot     

    plt.legend()
    # save plot as an image     

   plt.savefig("hist.png")
    # show plot     

    plt.show()
if __name__ == "__main__":
    data = [random.randint(0,1000) for i in xrange(0, 1000)]
    buildHist(data)


As a result you will see nice histogram, like this one:

2013-07-12

Faster filesearch with Python using glob

In case you have a big-sized deep folder structure with lots of different files the glob is much more faster then os.walk.

import os, sys, glob
def getFilelist(root):
    def listIter(subroot):
    '''Local recursive function.'''
        for name in glob.glob(os.path.join(subroot, '*')):
            print name
            listIter(name)
    listIter(root) # Call recursion.

if __name__ == '__main__':
    sys.exit(getFilelist(r'd:\example'))


In case of searching the group of certain files or folders among the huge amount of files - this search has better performance.

2013-03-22

Multiprocessing with Python

Let's consider the list containing huge amount of filenames. There is a necessity to perform certain action with each file in this list, for example to read first line and write all results into the file. Below is my working code with comments.

# First of all let's get the filelist:

import os
filelist = []
def getFileList(root_folder):
    '''
    Returns the list of files in specified folder.
    '''

    for root,dirs,files in os.walk(root_folder):
        for filename in files:
            filepath = os.path.join(root,filename)
            if os.path.isfile(filepath):
                filelist.append(filepath)
    return filelist

# And function to return 1st line from the file:

def readFirstLine(filename):
    '''
    Returns as text the first line from file.
    '''

    f = open(filename, "r")
    firstline = f.readlines()[0]
    f.close()
    return firstline

# The following function works with the list of files and throws the result into Queue.

def fileListProcessing(files, q):
    '''
    Puts first lines from all listed files into a Queue. Provides a safe way of getting the result from several processes.
    '''

    try:
        result = []
        for filename in files:
            result.append(readFirstLine(filename))
    except:
        q.put([])
        raise
    q.put(result)

# And here is an actual multiprocessing:

from multiprocessing import Queue, Process, cpu_count

def myMultiprocessing(folder):
    '''
    Splits the source filelist into sublists according to the number of CPU cores and provides multiprocessing of them.
    '''

    files = getFileList(folder)
    q = Queue()
    procs = []
    for i in xrange(0,cpu_count()):
        # Split the source filelist into several sublists.
        lst = [files[j] for j in xrange(0, len(files)) if j % cpu_count() == i]
        if len(lst)>0:
            p = Process(target=fileListProcessing, args=([lst, q]))
            p.start()
            procs += [p]
    # Collect the results:
    all_results = []
    for i in xrange(0, len(procs)):
        # Save all results from the queue.
        all_results += q.get()

    # Output results into the file.
    log = open("logfile.log", "w")
    print >>log, all_results
    log.close()

if __name__ == "__main__":
    myMultiprocessing("d:\\someFolder")

This seems to be an example of the multiprocessing with Python.

2012-11-10

Python: ElementTree to String

Виявив проблему при роботі із ElementTree.
I've met the problem with ElementTree usage.

import import xml.etree.cElementTree as etree
tree = etree.parse('example.xml')
spam = etree.tostring(tree)

Фрагмент коду, наведений вище, завжди буде давати помилку:
The code above will always give an error
"AttributeError: 'ElementTree' object has no attribute 'tag'"
Щоб уникнути цього, потрібно спочатку знайти кореневий тег і саме його конвертувати в string, а не цілий ElementTree
To fix this you should convert to string root, not ElementTree instance:

import import xml.etree.cElementTree as etree
tree = etree.parse('example.xml')
root = tree.getroot()
spam = etree.tostring(root)